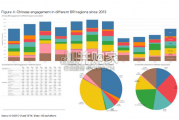
China’s financing and investment spread across 61 BRI countries in 2023 (up...
2024-02-27 31 英文报告下载
The pandemic affected all countries’ GDP in 2020 but with some noticeable disparities (Figure 1.2, Panel A), including sizeable differences across countries in the relative declines of nominal and real GDP, and implicitly in the GDP deflator. Cross-country variation in observed GDP outcomes arises from many different sources, including the timing and severity of the pandemic and the associated policy responses, the different sectoral mix of economic activities in each country, and differences in statistical procedures. This box explores the extent to which one particular statistical difference – the treatment of non-market services – accounts for some of the variation in real GDP growth across countries during 2020. While marked differences can be seen in the contributions from non-market services across countries, these are generally small relative to the overall changes in GDP and make little difference to the relative GDP declines across countries. These issues will remain pertinent in 2021, given the renewed shutdowns and subsequent reopenings that are occurring.Estimating the volume of output in the health and education sectors is challenging as output is often supplied without charge or at prices that are not economically significant.
Different conventions exist across national statistical institutes (NSIs) to compute the volume of non-market services: using deflated measures of input values, or direct volume measures of either inputs (such as the number of employees or hours worked) or outputs (such as the number of students or number of patients treated) (OECD, 2020a). The COVID-19 pandemic has added to these longstanding issues, with both sectors heavily affected by restrictions. For instance, workers may be paid as before during shutdowns but provide a reduced volume of services. This results in differences between approaches that deflate input costs (such as the wage bill, which did not change) or measure the volume of activities via inputs (such as the number of teachers, which did not change) or outputs (such as the number of students coming to school, which did change). Services may also be delivered in different ways, such as the partial replacement of school-provided education, which is included in GDP, with unpaid home schooling, which is not. Adjustments may also be needed to capture new activities, such as the introduction and rapid expansion of test, track and trace services, and more recently vaccinations, with associated technical issues of whether the weights given to these new activities are appropriate. The pandemic also temporarily revamped many health services from traditional to COVID-19-related care. All these factors may have reduced the comparability of economic outcomes across countries.

标签: 英文报告下载
相关文章

China’s financing and investment spread across 61 BRI countries in 2023 (up...
2024-02-27 31 英文报告下载

Though the risk of AI leading to catastrophe or human extinction had...
2024-02-26 51 英文报告下载

Focusing on the prospects for 2024, global growth is likely to come i...
2024-02-21 96 英文报告下载

Economic activity declined slightly on average, employment was roughly flat...
2024-02-07 67 英文报告下载

Economic growth can be defned as an increase in the quantity or quali...
2024-02-06 82 英文报告下载

In this initial quarterly survey, 41% of leaders reported their organizatio...
2024-02-05 66 英文报告下载
最新留言