China’s financing and investment spread across 61 BRI countries in 2023 (up...
2024-02-27 32 英文报告下载
Of course some cycles never get to Phase 2 or 3. Sometimes the initial adjustment lower in rates and the bounce in financial conditions seen in Phase 1 allows the economic expansion to resume. Even if Phase 2 does emerge, it might create a significant enough adjustment in risky assets and valuations that helps the economic cycle to pick up steam again, meaning we never get close to Phase 3. Markets may also vacillate between different phases – particularly Phases 1 and 2 – as financial market adjustments may briefly support data before it turns down again. In the last thirty years, the US cycle has seen a number of slowdowns, with varying degrees of severity (Chart 1). The questions we answer in this piece are: what Phase of the slowdown are we currently in and what does it mean for FX? Phase in, phase out We believe we are firmly in Phase 2, with markets potentially needing to price in Phase 3. The market seems less convinced and has even attempted to try the Phase 1 playbook in recent weeks. This could make any possible shift from Phase 2 to Phase 3 even more jarring. It’s the hope that kills you As any English cricket fan of the last thirty years will tell you, it isn’t losing games that hurts.
What’s really painful is getting into a position where you should be winning, and then collapsing to a humiliating loss. Markets are potentially setting themselves up for similar pain. Bad news: from good news to bad news In the last few years, as the global data pulse started to gradually slow, there was something of a “bad news is good news” approach to economic data. In particular, as US data started to underperform, market sentiment appeared to be buoyed by the idea that the Fed would cut rates. This lower cost of capital would more than offset any decline in growth. This is Phase 1. We can see this in the FX market in Chart 2 where we look at the relationship between AUD-JPY – traditionally very “risk on-risk off” currency pair – and negative US data surprises. The red line shows the correlation between these indicators, and the grey line the beta, since 2017. For most of 2018 the reappraisal of rate expectations following disappointing activity data helped to buoy risky assets. This is Phase 1 where bad news is good news. As such AUD-JPY displayed a generally negative correlation to negative US data surprises. When US data was worse than expected, AUD-JPY tended to rally.
This is one sign that we have moved more firmly into Phase 2 for FX, in our view. But there are also other indicators we are tracking. Rate cuts – no distance left to run As the broader economic data has been weakening for some time, with little sign of improvement, we have already seen a large reaction in interest rate expectations lower. Policy rates are close to or even below zero in many economies, and there appears to be little room for further rate adjustment to the downside (Chart 3). This pushes us firmly towards Phase 2, in our view. If rates cannot move much lower then there is little room for easing expectations to offset weaker growth expectations. Without the offset of a lower cost of capital, bad news is bad news. This is a clear sign of being in Phase 2.
")
标签: 英文报告下载
相关文章
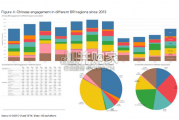
China’s financing and investment spread across 61 BRI countries in 2023 (up...
2024-02-27 32 英文报告下载
Though the risk of AI leading to catastrophe or human extinction had...
2024-02-26 53 英文报告下载
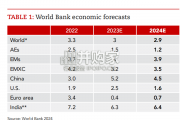
Focusing on the prospects for 2024, global growth is likely to come i...
2024-02-21 99 英文报告下载
Economic activity declined slightly on average, employment was roughly flat...
2024-02-07 68 英文报告下载
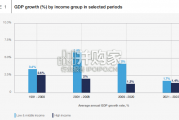
Economic growth can be defned as an increase in the quantity or quali...
2024-02-06 82 英文报告下载
In this initial quarterly survey, 41% of leaders reported their organizatio...
2024-02-05 66 英文报告下载
最新留言