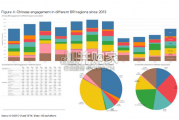
China’s financing and investment spread across 61 BRI countries in 2023 (up...
2024-02-27 31 英文报告下载
Tanker: Positive on both crude carriers and product carriers (refined oil products) • As seen in 2016-2017, US crude exports can drive longer shipping distance in the global seaborne crude trade and are supportive of newbuild demand going forward. US crude exports should grow from sub-3m bpd today to up to 8m bpd with increased export terminal capacity by end-2020 (Global oil – Corpus Christi tested as a crude export hub, 7 June 2019). This growth should require nearly 100x VLCCs (assuming they take market share from Middle East exports in a flattish market), or 30,000k DWT. • Crude carrier newbuild deliveries are peaking in 2019 with 83x VLCC equivalents (2 Suezmax = 1 VLCC), 66x VLCCs and 35x Suezmax. Growing US crude exports in the next two years should provide 50 units annualized of VLCC newbuilds under a zero tonnage growth assumption, given the current outstanding crude carrier fleet is 1,062x VLCC equivalent. The US is expected to drive close to 10% of demand growth over the next two years, or 5% pa In addition; we expect 1% YoY global seaborne crude oil trade growth (tonnage) this year, followed by long-term growth of 2% CAGR. • We are keeping our bullish view on product carriers (Asia shipbuilding – Product carrier market bottoming, 16 November 2018) on IMO2020-led demand for LSFO. However, recovery has been milder than we anticipated. A one-year timecharter of a medium range (MR) product carrier remains at an elevated level, and yet newbuild demand is slow at 49 MR product carriers in 11M19 (vs. Macquarie forecast of 79 units). Scrappage of aged fleet (~20% of outstanding fleet is more than 15 years old) has been much slower than we expected as shipowners try to leverage timecharter recovery. Slow newbuild orders placed in 2019 should lead to further tightening of the market in 2020/21.
Container ship: Seaborne trade growth normalizes, albeit lower level, amid ongoing oversupply • Since the global financial crisis, seaborne container trade growth has moderated with GDP multiplier declining to average 1.2x during 2011-19. Slow growth was triggered by 1) slow outsourcing (or even ‘reshoring’, moving production facilities near demand market, developed countries, from China and other emerging countries), more moderate expansion in the Chinese economy, and matured containerisation. Nevertheless, we expect seaborne container trade to grow par to global GDP growth from 2020 once US-China trade tension eases. In 2019, we project 0.2x for the full year, lowest since 2015 (0.6x). • Container fleet continues to outgrow seaborne container trade growth at least till 2020. Fleet renewal is driven mainly by container liners’ effort to lower per TEU delivery cost and container ship fleet, especially large-sized vessels, is young. Container has the lowest mix of 15 years or older fleet (13%) among major vessel types (LNGC: 23%, bulker: 17%, tanker: 16%).

标签: 英文报告下载
相关文章

China’s financing and investment spread across 61 BRI countries in 2023 (up...
2024-02-27 31 英文报告下载

Though the risk of AI leading to catastrophe or human extinction had...
2024-02-26 52 英文报告下载

Focusing on the prospects for 2024, global growth is likely to come i...
2024-02-21 96 英文报告下载

Economic activity declined slightly on average, employment was roughly flat...
2024-02-07 67 英文报告下载

Economic growth can be defned as an increase in the quantity or quali...
2024-02-06 82 英文报告下载

In this initial quarterly survey, 41% of leaders reported their organizatio...
2024-02-05 66 英文报告下载
最新留言