China’s financing and investment spread across 61 BRI countries in 2023 (up...
2024-02-27 31 英文报告下载
Monitoring the pulse of innovation is no easy task. Transforming an idea into a new good or service can take months, if not years. It takes even longer for technological advances to be widely adopted, create new jobs, enhance economic productivity and improve people’s health and well-being. Today’s progress is the result of past innovations; today’s innovations, in turn, sow the seeds for progress in the years to come. No single indicator captures the full spectrum of innovation performance from idea inception to impact. This is precisely why the GII relies on a wide set of indicators to measure the innovation performance of economies. Similarly, to capture key innovation trends, the Global Innovation Tracker looks at a variety of data points. It does so for three broad stages of the innovation journey: science and innovation investments; technological progress; and socioeconomic impact. Science and innovation investments The global pandemic has had a profound effect on economic activity.
Global output declined by 3.3 percent in 2020, as containment measures to tackle the pandemic caused overall demand to decline and supply chains to fail (IMF, 2021). Financial market uncertainty soared. Historical experience would suggest that such adverse conditions would prompt a cutback in innovation investments. In many ways, however, this crisis differs from previous macroeconomic crises. Certain sectors – from personal protective equipment and consumer electronics to bicycles and home delivery services – actually experienced increased demand. Innovation, in turn, has been at the center of the fight to combat the pandemic and contain its impact. The key indicators of global science and innovation investments – scientific publications, research and development (R&D) expenditures, international patent filings and venture capital deals – reflect this mixed impact of the pandemic. Scientific publications The pandemic has left no obvious mark on overall scientific output. The publication of scientific articles worldwide grew by 7.6 percent in 2020 – lower than the 2019 growth rate, but faster than the 10-year average growth rate (see Dashboard). The top five origins of scientific output – China, the United States, the United Kingdom, Germany and India – all saw lower growth in 2020 than in 2019, bearing in mind that the 2019 growth rates were exceptionally high.

标签: 英文报告下载
相关文章
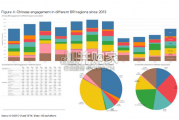
China’s financing and investment spread across 61 BRI countries in 2023 (up...
2024-02-27 31 英文报告下载

Though the risk of AI leading to catastrophe or human extinction had...
2024-02-26 51 英文报告下载
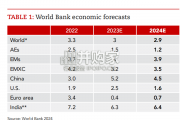
Focusing on the prospects for 2024, global growth is likely to come i...
2024-02-21 96 英文报告下载
Economic activity declined slightly on average, employment was roughly flat...
2024-02-07 67 英文报告下载
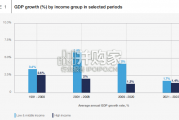
Economic growth can be defned as an increase in the quantity or quali...
2024-02-06 82 英文报告下载
In this initial quarterly survey, 41% of leaders reported their organizatio...
2024-02-05 66 英文报告下载
最新留言