China’s financing and investment spread across 61 BRI countries in 2023 (up...
2024-02-27 30 英文报告下载
To analyze changes in the composition of total family wealth, CBO separated family wealth into six mutually exclusive categories—nonmortgage debt and fve types of assets. Te asset categories are home equity, nonretirement fnancial assets, wealth from defned beneft retirement plans, wealth from defned contribution retirement plans, and other assets. (Together, defned beneft wealth and defned contribution wealth constitute retirement assets. For detailed defnitions of all six categories, see Appendix A.) Te total value of all fve asset categories increased from 1989 to 2019, but those gains were partially ofset by the rise in nonmortgage debt. Te assets whose real value increased the most over the 30-year period were defned contribution wealth, which climbed by 599 percent (an average annual rate of 6.7 percent), and nonretirement fnancial assets, which grew by 238 percent (an average annual rate of 4.1 percent). Meanwhile, nonmortgage debt increased by 173 percent (an average annual rate of 3.4 percent). (Tose rates are compound annual growth rates calculated using the values for the frst and last year of the period.) Of all assets, home equity rose the least, increasing by 127 percent over the 30-year period (an average annual rate of 2.8 percent).
Driven by increasing home values, the total value of home equity increased by 125 percent from 1989 to 2007, but it declined over the next three years as home prices fell and the percentage of families that owned homes decreased during the 2007–2009 recession. Total home equity rose once again as the housing market recovered, and by 2019, it had surpassed its prerecession peak. Te composition of total family wealth changed during the period. Measured as a percentage of total family wealth, home equity and other assets declined slightly, whereas nonretirement fnancial assets and retirement wealth increased slightly; nonmortgage debt remained roughly unchanged. Although total defned beneft wealth increased throughout the 30-year period, defned beneft plans became less common, so the share of total retirement assets attributable to defned beneft wealth declined. Defned contribution wealth’s share of retirement wealth increased from less than one-third in 1989 to almost one-half by 2007, and it continued to grow modestly thereafter. By 2019, defned contribution wealth accounted for slightly more than half of retirement wealth.
")
标签: 英文报告下载
相关文章
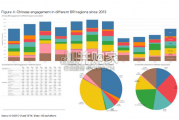
China’s financing and investment spread across 61 BRI countries in 2023 (up...
2024-02-27 30 英文报告下载
Though the risk of AI leading to catastrophe or human extinction had...
2024-02-26 50 英文报告下载
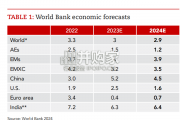
Focusing on the prospects for 2024, global growth is likely to come i...
2024-02-21 95 英文报告下载
Economic activity declined slightly on average, employment was roughly flat...
2024-02-07 66 英文报告下载
Economic growth can be defned as an increase in the quantity or quali...
2024-02-06 82 英文报告下载
In this initial quarterly survey, 41% of leaders reported their organizatio...
2024-02-05 66 英文报告下载
最新留言