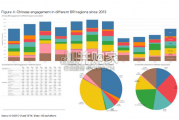
China’s financing and investment spread across 61 BRI countries in 2023 (up...
2024-02-27 31 英文报告下载
Each stock in the SPX is assigned a cross-sectional Z-Scored exposure to each of these factors (China Sales % is not Z-Scored due to the number of stocks with no China exposure). We then perform a cross-sectional joint regression of all the factors against the individual stock returns for the month. The resultant T-Stats of this regression shows which factors had the most influence on returns during the month. Figure 5 shows that the primary drivers of return for the SPX stocks in February were Value (negative correlation), Beta to TLT (positive correlation), and dollar Beta (negative correlation). These results indicate somewhat of a mixed market environment, with TLT Beta stocks rising along with Growth stocks and those with more China exposure. Although coronavirus fears have clearly impact equity market overall the selloff seems to be highly correlated, with numerous categories of stocks (Defensive, cyclical, domestic oriented, internationally exposed, etc.) declining at near equal levels. However, the decline in rates continues to be very strong, explaining the importance of TLT Beta in the regression, and Value continues to strongly underperform.
Our bottom-up NTM S&P 500 EPS Growth projections improved in February (from -3.3% to -1.7%) but has now been in negative territory for over a year. The increase in our model projections was driven by a sudden rise in the smoothed LEI 3M change (+1.7% contribution) as consensus EPS NTM forecasts continued to falter (from 6.7% to 6.3%). Figure 7 shows a formal attribution of the components of our Bottom-Up model, on both an NTM basis and for a fixed calendar period (2020Q1 – 2020Q4). Our Bottom-Up model forecast for the 2020Q1 – 2020Q4 period rose by +1.6% over the last month, but has still declined noticeably over the last 6M (-2.6%). The recent increase has been solely driven by improving LEI, while the 6M change in our projections has been driven by declines in consensus expectations, LEI 3MA, and the interaction between LEI and consensus expectations.

标签: 英文报告下载
相关文章
China’s financing and investment spread across 61 BRI countries in 2023 (up...
2024-02-27 31 英文报告下载
Though the risk of AI leading to catastrophe or human extinction had...
2024-02-26 52 英文报告下载
Focusing on the prospects for 2024, global growth is likely to come i...
2024-02-21 96 英文报告下载
Economic activity declined slightly on average, employment was roughly flat...
2024-02-07 67 英文报告下载
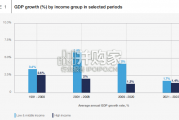
Economic growth can be defned as an increase in the quantity or quali...
2024-02-06 82 英文报告下载
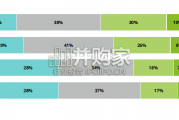
In this initial quarterly survey, 41% of leaders reported their organizatio...
2024-02-05 66 英文报告下载
最新留言