China’s financing and investment spread across 61 BRI countries in 2023 (up...
2024-02-27 31 英文报告下载
Chinese frms listed on domestic and foreign stock markets disclose details about their operations and cashfows in their stock market flings, including subsidies and tax rebates they receive. Tis listed frm data is the basis for much of the sectoral research on Chinese frms. Drawing on research from Gatley (2019), Lardy (2019), García-Herrero and Ng (2021), and data from WIND, the Chinese-based economic data provider, this study is able to estimate the “direct subsidies” and “other tax incentives” for China with data from listed frms.4 One shortcoming of this approach is that Chinese listed frms are not necessarily representative of all Chinese companies. Listed frms are biased toward larger and state-owned frms, with private frms underrepresented.
SOEs accounted for about 60 percent of the market capitalization on China’s largecap stock index in 2019, even though they contributed only 25 percent of GDP.5 On the other hand, small and medium-sized enterprises (SMEs), which are rarely listed, are generally private. Chinese listed frms reported subsidies of 281 billion yuan in 2019 ($41 billion), with the share going to private frms almost equaling that going to SOEs in recent years.6 From the data on listed frm subsidies, a picture emerges of how China is allocating its subsidies by sub-sector (see Figure 2.4). In absolute terms, most of the subsidies are directed at spending for capital goods, materials, and technology hardware. But relative to their profts, the biggest benefciaries of subsidies are frms in software, technology hardware, automobiles, transportation, and semiconductors. Tis is not surprising, as these are all priority sectors for Beijing.
")
标签: 英文报告下载
相关文章
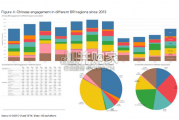
China’s financing and investment spread across 61 BRI countries in 2023 (up...
2024-02-27 31 英文报告下载
Though the risk of AI leading to catastrophe or human extinction had...
2024-02-26 51 英文报告下载
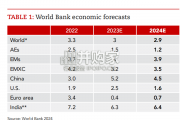
Focusing on the prospects for 2024, global growth is likely to come i...
2024-02-21 96 英文报告下载
Economic activity declined slightly on average, employment was roughly flat...
2024-02-07 67 英文报告下载
Economic growth can be defned as an increase in the quantity or quali...
2024-02-06 82 英文报告下载
In this initial quarterly survey, 41% of leaders reported their organizatio...
2024-02-05 66 英文报告下载
最新留言